


因为经常使用 matplotlib 进行绘图,因此将一些常用的绘图方法,以及相应的绘图代码进行记录。希望能够帮助有需要的人。
1. 折线图
import matplotlib.pyplot as plt
A = [2270.21, 2300.59, 2311.66, 5162.39, 5130.17]
B = [1106.78, 1104.42, 1159.71, 2151.70, 2216.21]
C = [304.36, 303.07, 304.36, 417.93, 417.72]
X = [1, 2, 3, 4, 5]
plt.xlabel('Tasks', size=14)
plt.ylabel('Running Time (s)', size=14)
plt.plot(X, A, color='lightcoral', linewidth=3, marker='o', markersize=7, label='A')
plt.plot(X, B, color='skyblue', linewidth=3, marker='o', markersize=7, label='B')
plt.plot(X, C, color='plum', linewidth=3, marker='o', markersize=7, label='C')
plt.xticks(X, ('T1', 'T2', 'T3', 'T4', 'T5'), size=14)
plt.yticks(size=14)
plt.legend(['A', 'B', 'C'])
plt.grid()
plt.show()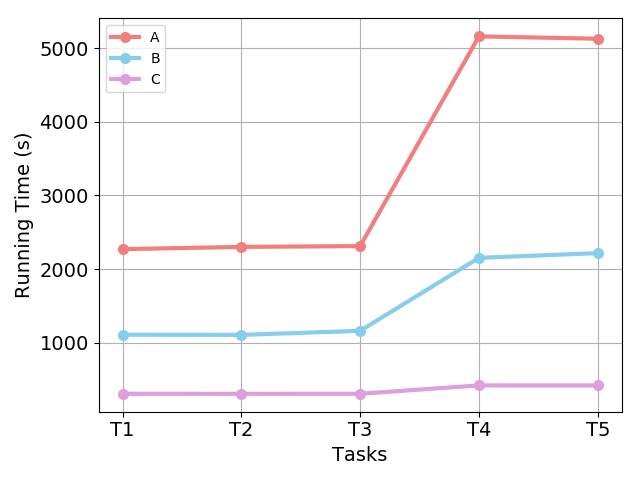
2. 直方图
import matplotlib.pyplot as plt
A = [2270.21, 2300.59, 2311.66, 5162.39, 5130.17]
B = [1106.78, 1104.42, 1159.71, 2151.70, 2216.21]
C = [304.36, 303.07, 304.36, 417.93, 417.72]
X = ['T1', 'T2', 'T3', 'T4', 'T5']
x = range(5)
rects1 = plt.bar(left=x, height=A, width=0.2, alpha=0.8, color='lightcoral', label="A")
rects2 = plt.bar(left=[i + 0.2 for i in x], height=B, width=0.2, color='skyblue', label="B")
rects3 = plt.bar(left=[i + 0.4 for i in x], height=C, width=0.2, color='plum', label="C")
plt.xticks([i + 0.2 for i in x], X, size=14)
plt.yticks(size=14)
plt.xlabel('Tasks', size=14)
plt.ylabel('Running Time (s)', size=14)
plt.legend(['A', 'B', 'C'])
plt.grid()
# for rect in rects1:
#     height = rect.get_height()
#     plt.text(rect.get_x() + rect.get_width() / 2, height+1, str(height), ha="center", va="bottom")
# for rect in rects2:
#     height = rect.get_height()
#     plt.text(rect.get_x() + rect.get_width() / 2, height+1, str(height), ha="center", va="bottom")
# for rect in rects3:
#     height = rect.get_height()
#     plt.text(rect.get_x() + rect.get_width() / 2, height+1, str(height), ha="center", va="bottom")
plt.show()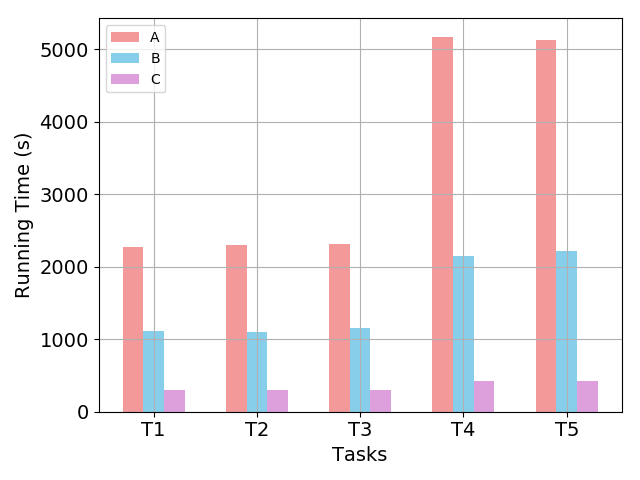
3. 散点图
n = 50
    for i in range(5):
        t = np.random.random(size=n) * 2 * np.pi - np.pi
        x1 = np.cos(t) * 7
        x2 = np.sin(t) * 7
        for j in range(n):
            if i == 0:
                val = np.sqrt(np.random.random())
                x1[j] = x1[j] * val - 10
                x2[j] = x2[j] * val - 10
            elif i == 1:
                val = np.sqrt(np.random.random())
                x1[j] = x1[j] * val - 10
                x2[j] = x2[j] * val + 10
            elif i == 2:
                val = np.sqrt(np.random.random())
                x1[j] = x1[j] * val + 10
                x2[j] = x2[j] * val - 10
            elif i == 3:
                val = np.sqrt(np.random.random())
                x1[j] = x1[j] * val + 10
                x2[j] = x2[j] * val + 10
            elif i == 4:
                val = np.sqrt(np.random.random())
                x1[j] = x1[j] * val
                x2[j] = x2[j] * val

        for j in range(n):
            val = np.sqrt(np.random.random())
            x1[j] = x1[j] * val
            x2[j] = x2[j] * val
        if i == 0:
            plt.scatter(x1, x2, marker='o', label="A", s=15, color='#e54d42', alpha=0.6)
        elif i == 1:
            plt.scatter(x1, x2, marker='o', label="B", s=15, color='#fbbd08', alpha=0.6)
        elif i == 2:
            plt.scatter(x1, x2, marker='o', label="C", s=15, color='#39b54a', alpha=0.6)
        elif i == 3:
            plt.scatter(x1, x2, marker='o', label="D", s=15, color='#0081ff', alpha=0.6)
        else:
            plt.scatter(x1, x2, marker='o', label="E", s=15, color='#9c26b0', alpha=0.6)

    plt.xlim(-25, 15)
    plt.ylim(-25, 15)
    plt.legend(loc="upper left", fontsize=10, markerscale=1.5, handletextpad=0.3)
    plt.savefig("d:/scatter.pdf", dpi=600, format="pdf")
    plt.show()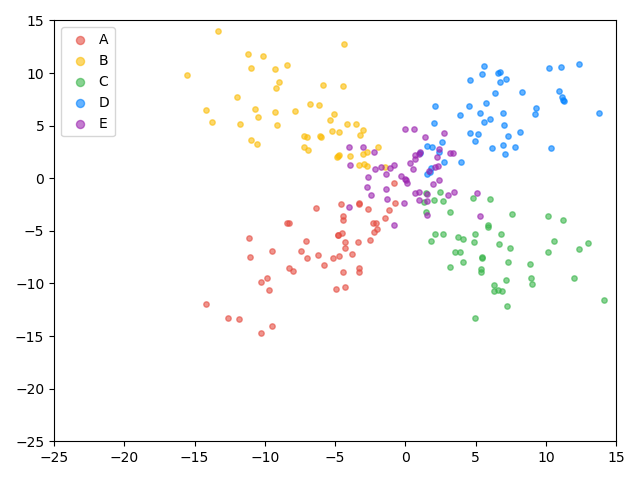
Comments | NOTHING